

When you leave your country for a certain amount of time, what do you miss the most? Probably your family, friends, and the community you had in your country?
But for many non-resident Indians (NRIs), there is something different.
Recently, I was talking to a colleague who’d just wrapped up a European trip. They were overjoyed to be back in a place with an AQI of 130 from 9. During our conversation, I asked them what they missed the most. And what disappointed them about Europe?
The answer was kind of refreshing; I am not gonna lie. I was expecting the third point they made to be the primary one, like most do. House help & 10-min delivery.
This is something that has been sitting in an uncomfortable middle for me for a long time. I get the point about the double thank-you moment. You are paying someone for their services. You both are better because of that. The househelp is getting paid, otherwise they wouldn’t be able to. And you are not getting bothered about the chores, and can focus your energy somewhere else.
The other side is this: this is not a glamorous job at any cost. And this is a big bug of the Indian socio-economic scene. This shouldn’t be celebrated as a big feature that we often tend to do. Yes, they are doing better because of the opportunity, because I am paying. But they could’ve done far better if there was a better opportunity.
Anyways. I thought of quantifying my discomfort. And I went down a deep rabbit hole. I have spent a lot of time and tokens on this, more than I would have liked to. This probably needs multiple blog posts to do a proper narrative-driven summary.
In any case, it would be good to summarise a few things.
So the actual question. Is domestic help in India cheap? And Cheap compared to what?
Drawing a line in the sand is often important in analytics. So here is one quick assumption that I made: India’s PLFS data breaks down what Indians earn on average: self-employed workers make about ₹13,279 a month, regular salaried employees about ₹20,702, casual labourers about ₹12,750. I made a weighted average of how much of the workforce falls into each bucket (roughly ~ 56%, 24%, and 20%), and it turned out about ₹15,000 a month.
But that’s everyone. Street vendors, casual construction labour, salaried clerks- everyone is included there. Domestic help is a much narrower and more specific market. Not everyone can buy it, and it’s concentrated in T1 and T2 cities. Ask around in a Mega city, and the number you’ll actually hear for full-time domestic help is somewhere between ₹20,000 and ₹30,000 a month. So that’s what I’m using here: ₹25,000, the midpoint.
The obvious way to check if this is “cheap”: price a full-time domestic worker against the country’s own GDP per capita. And check if you can spot a pattern there.
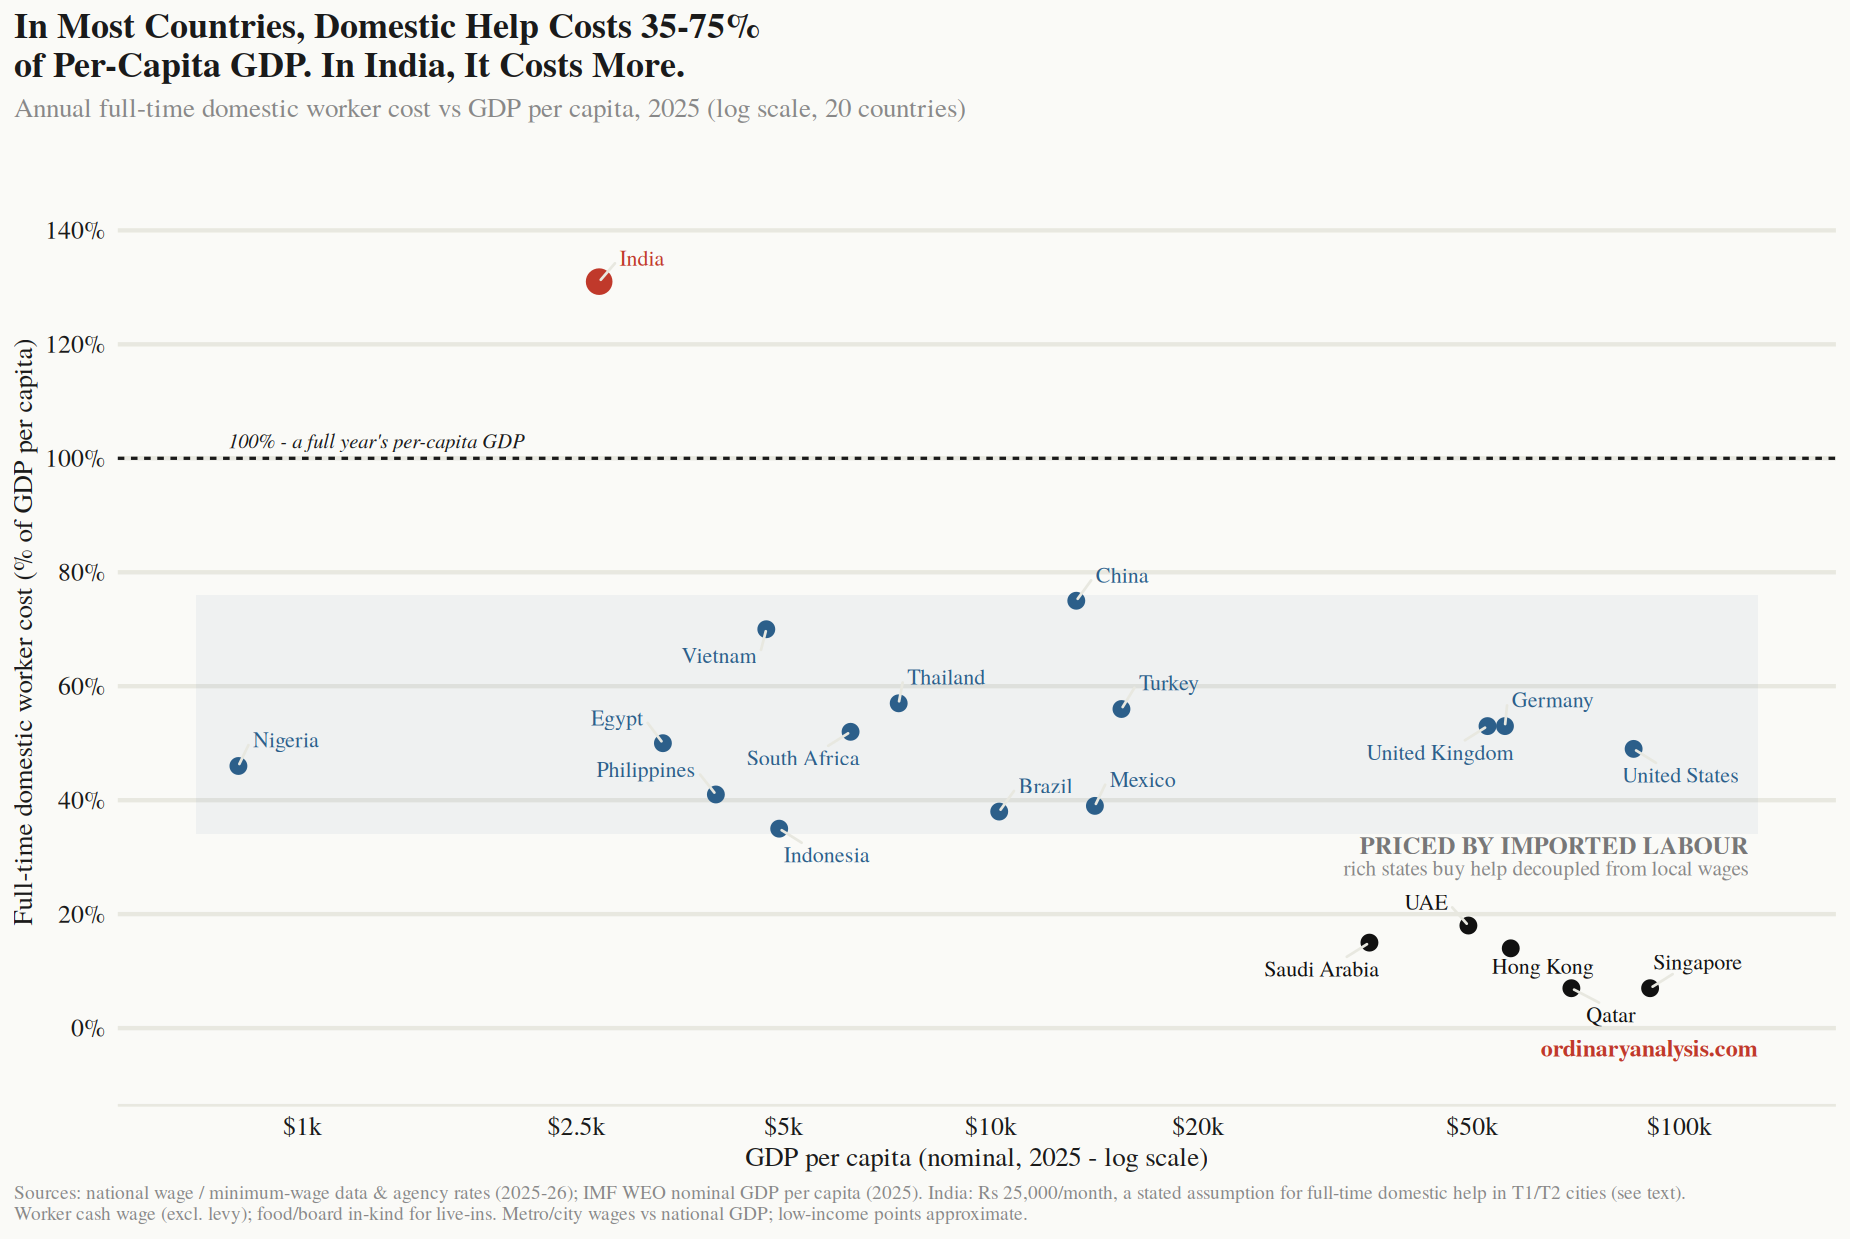
And the naive answer surprised me. India isn’t the cheapest country on this list. It’s the most expensive, by a wide margin. A full-time domestic worker here costs more than the average Indian’s entire annual income. Not a large share of it. Even if we use the earlier discussed 15k number, the percentage would still be close to or more than 100%.
Nowhere else in the sample gets anywhere close, rich or poor. This holds almost everywhere where labour is priced locally, whether the country is poor or comfortably rich. It only breaks for a handful of places (Singapore, the Gulf, Hong Kong) where they don’t price domestic help off their own wages at all but rather import it from somewhere cheaper. Another country.
So the popular intuition, that help is dirt cheap here because we’re a poor country, goes for a toss if we take a look at GDP per capita numbers.
But comparing cost to GDP per capita has a slight problem. GDP per capita isn’t what a person actually earns. It’s the country’s total economic output divided by literally everyone, including your niece who’s still in school. There’s a sharper, more honest question hiding underneath the naive scatter plot.
How many hours of someone else’s work can an hour of your own work buy?
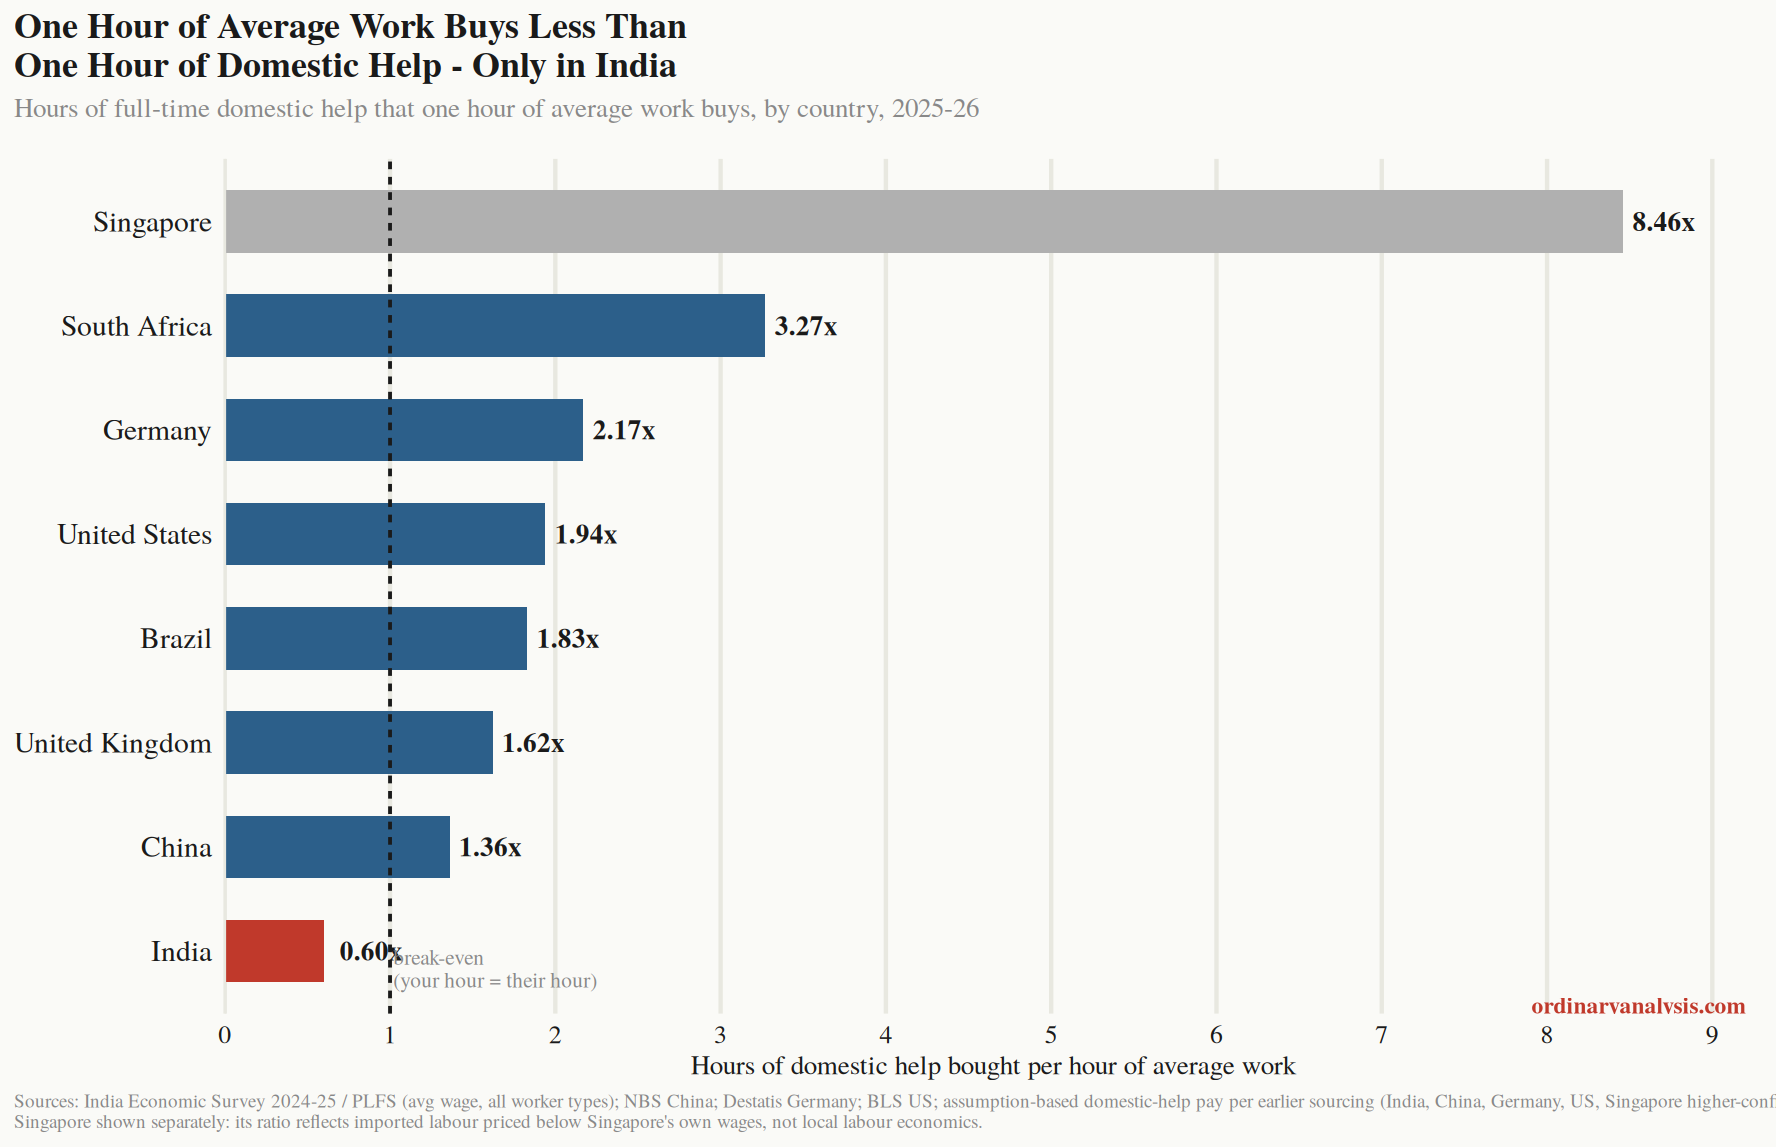
This is where it stopped being an interesting fact and started being a bit uncomfortable. Everywhere else in the sample, an hour of average work buys more than an hour of domestic help. In India, it buys less. An average Indian’s hour of work buys less than an hour of a domestic worker’s time, not more. (Singapore’s number is enormous, but for a completely different reason. That’s imported labour, as we have already discussed.)
Also - one thing to keep in mind here. Which is the crux of the matter. We already have established that domestic help is not a glorious job. But for a large section of the Indian social strata, even the opportunity of doing that in a T1 or T2 can feel aspirational.
So that’s the number underneath my discomfort, finally. It’s not that help is a bargain here. It’s that too many people don’t have a better option than to sell an hour of their time for less than it’s worth. This is, for sure, not a feature of how efficiently the Indian state has organised the economy - and that probably shouldn’t be celebrated.
This is just what a very low floor looks like, once you measure it. And the low floor might be lucrative for many.
While writing this post, I randomly remembered something an extremely annoying (he was complaining too much about Kolkata, his ex-wife, parents and many other things) Uber driver once told me: how can you tell if someone is really rich? Just see if they can hire a full-time driver.
Observations, data, and the not-so-ordinary world. Subscribe if that's your kind of thing.
Read more of my writings here, and learn about me here. I also write essays on tech, product, and strategy over here.
If you found this interesting, I would love to hear your thoughts.
Notes on the data
Chart 1 — Domestic help cost vs. GDP per capita (20 countries)
GDP per capita: IMF WEO, nominal 2025, all countries.
Domestic help cost (% of GDP per capita), by source confidence:
Stated assumption: India, ₹25,000/month, full-time domestic help in T1/T2 cities.
High confidence, real statutory/government figures: Philippines (DOLE Kasambahay wage order, NCR minimum), South Africa (Sectoral Determination 7 / BCEA minimum wage, R28.79/hr), Hong Kong (Migrant Domestic Helper Minimum Allowable Wage, HK Immigration Department).
Medium confidence, aggregator or agency-rate based: China (city-level ayi/cleaner rate estimates), Indonesia (Jakarta live-in ART estimates), Thailand (Bangkok live-in estimates), Mexico (empleada de planta wage estimates), Brazil (mensalista wage estimates), United States (full-time housekeeper/nanny salary aggregators), United Kingdom (housekeeper salary aggregators), Germany (Putzperle/go-quitt minijob-rate sources), Singapore (FDW wage, MOM-adjacent sources).
Low confidence, thin sourcing, treat as plus or minus 10 points: Vietnam, Turkey, Nigeria, Egypt (live-in domestic wage estimates from limited sources), Qatar, Saudi Arabia, UAE (migrant domestic worker wage, agency-adjacent sources).
Chart 2 — Hours of domestic help one hour of average work buys (8 countries)
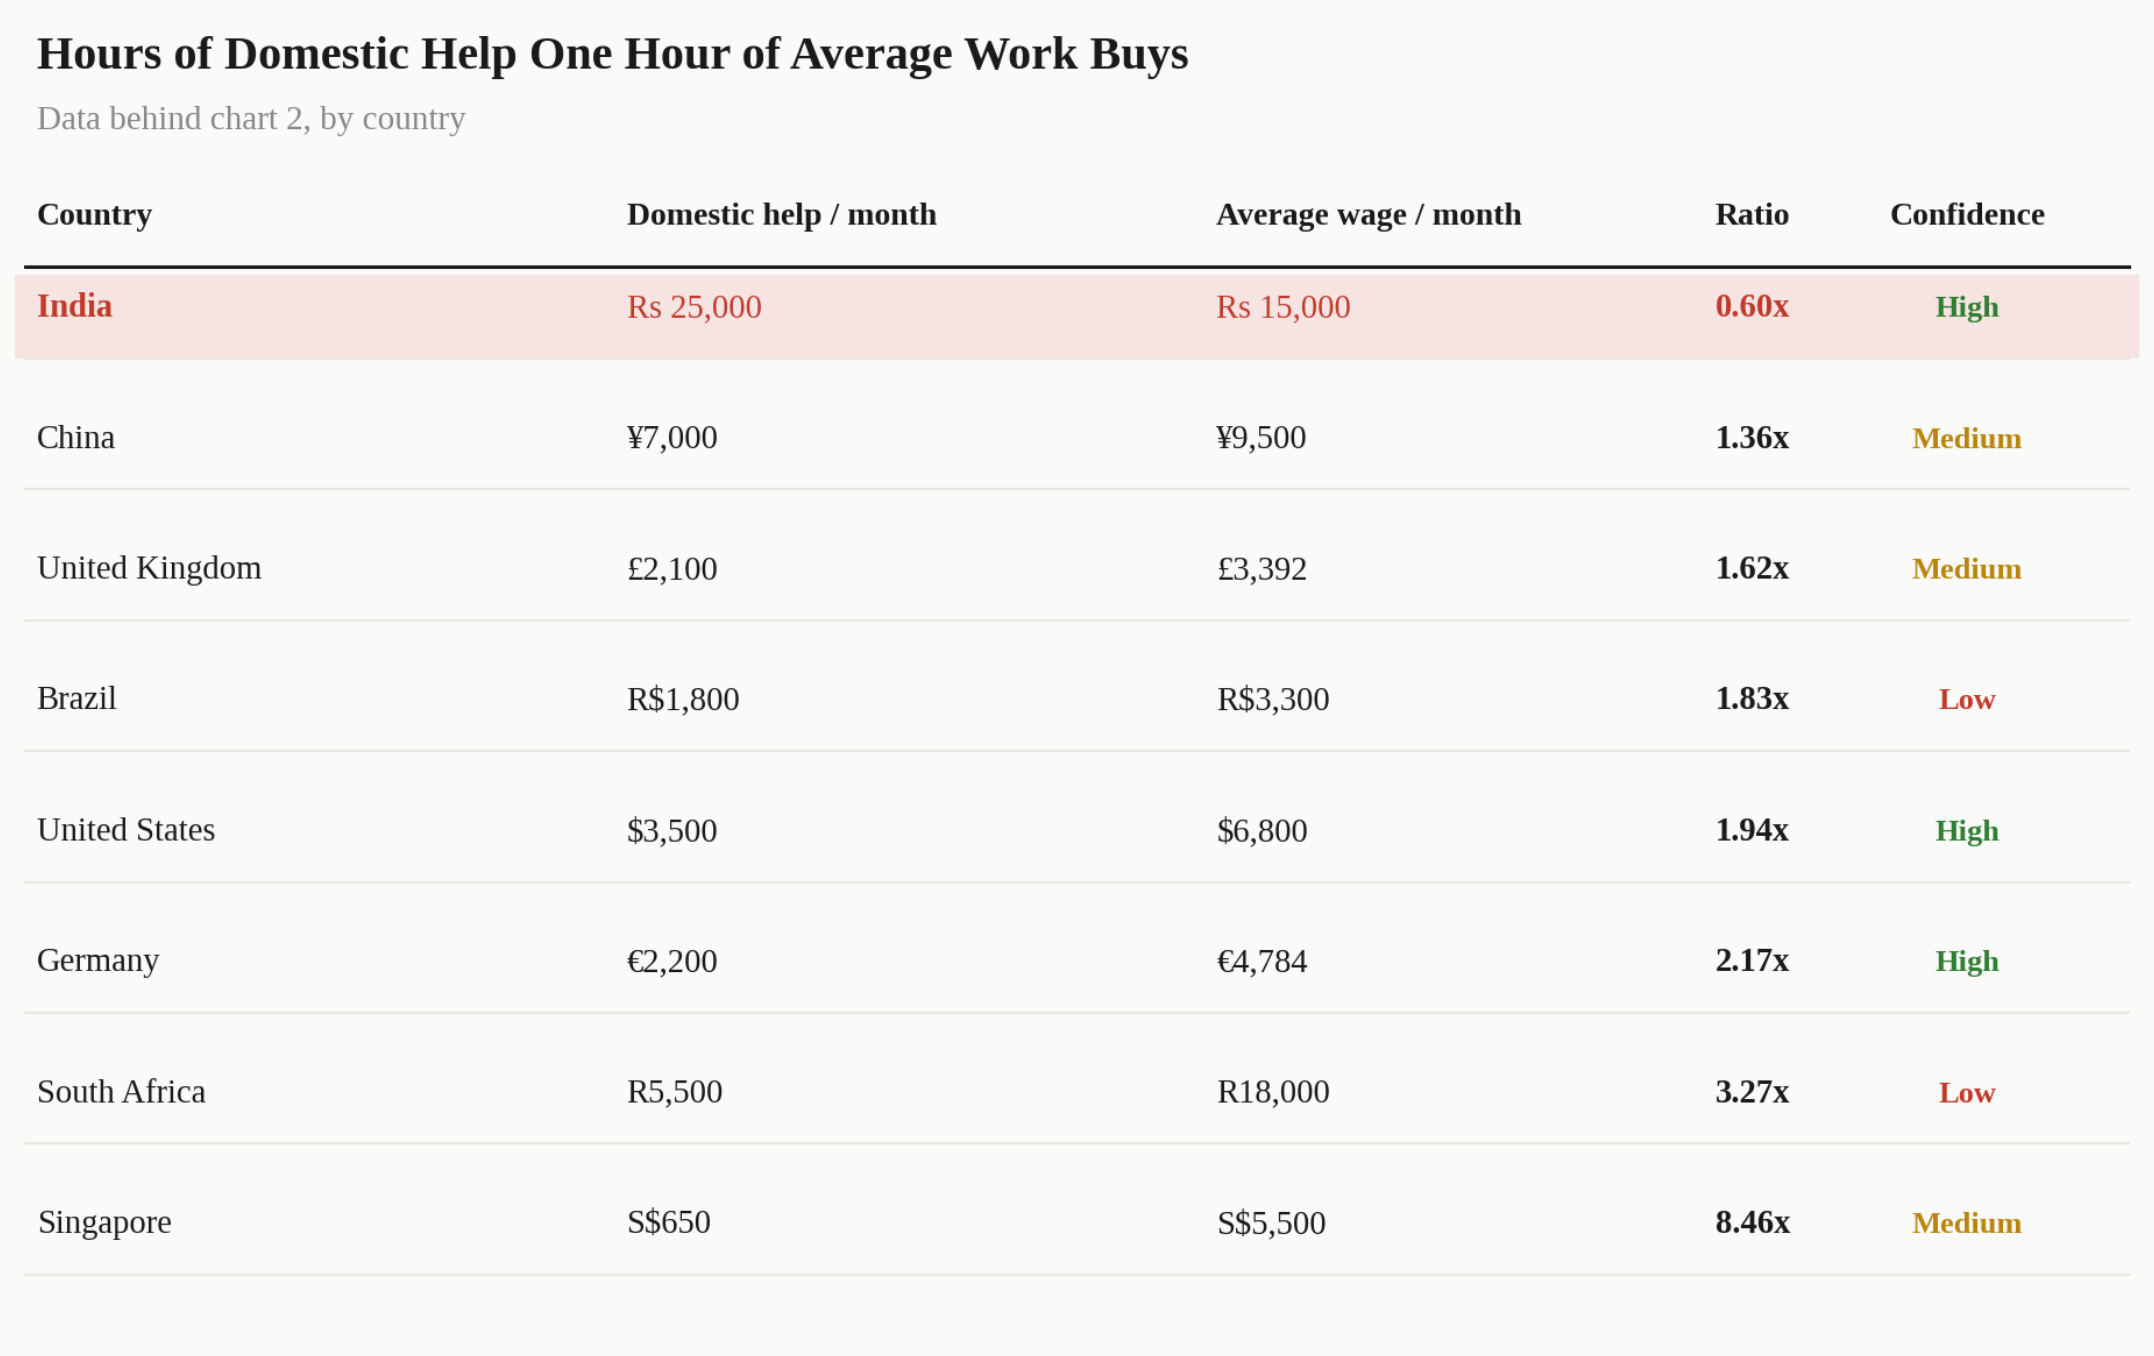
Singapore’s ratio (8.46) reflects imported labour priced below Singapore’s own wages, not local wage compression. It’s structurally different from every other row in this table and shouldn’t be read as “cheap” in the same sense India, Brazil, or Germany are.
The weakest links in this table, flagged plainly: Brazil’s and South Africa’s average-wage figures, and the UK’s, don’t have a primary-source citation behind them. Everything else traces to a named statistical office or government wage order.