

Exit polls are often treated as gospel or fraud. As an analytics professional, I’m more interested in the methodology that drives the number. If you are into Analytics and Data Science, then the exit poll of 5 states had some interesting takeaways. There were many exit poll predictions made this time, one such was by Noida based Praja Poll Analytics (PPA). They had projected BJP to win 200 odd seats in West Bengal (BJP ended up winning 207).
I didn’t pay much attention to exit polls, and what they had projected, until someone brought to my attention one tweet which was supposed to be “exposing” the fraud techniques of PPA.
At that moment I found it quite interesting 1. I tweeted about it but couldn’t write this one up. I had some major family functions. So I thought I would write up why I found their numbers and methods quite interesting. Being an Analytics professional, it made some sense to me.
First things first, one thing that we need to keep in mind: every model is wrong. Some are useful. There are some assumptions that you need to make while modelling.
In this video, we can hear the head of PPA talking about their assumptions and methodologies. They apparently covered more than 6 lakh voters in West Bengal. 4.5 lakh were male and 1.5 lakh were female. They started doing this 4-5 months before the poll. They seemed to be following a bottoms-up approach, as opposed to Axis My India which follows a top-down approach. Pradeep Gupta of Axis My India had mentioned this distinction2. Their first job is to gauge who is winning the election (a macro trend), and then they try to predict how much everyone is getting. PPA seems to be doing the opposite.
Anyways, doubling down on their methodology now, one by one.
4.5L Male vs 1.5L Female
I had an assignment in my previous company. I had to build a model to predict whether a doctor would recommend a prescription drug. We found that the presence of one particular risk factor almost guaranteed that this medicine would be prescribed, roughly 90% of the time. If it was absent, things became trickier, and we had to do some complicated modelling for that.
What we did was simple. If the risk factor is present, it is automatically a positive case for prescription. For the rest, a model is used.
When someone pointed out the 4.5L vs 1.5L split in a reply to that tweet, they called it a biased sample. I thought the opposite. This imbalance is a feature, not a bug.
Women in West Bengal have overwhelmingly voted for TMC. Maybe except a small section, the preference is near-deterministic. So once you start calculating from your sample and see that irrespective of age, location, or anything else, a statistically significant number of women voters are going to one party, you don’t really need more of them. A homogeneous group doesn’t need a large sample to be estimated accurately. You can simulate voters in each constituency from a smaller base, and make a healthy projection.
Male voters are the ones who differ a lot demographically (at least that has been the case historically). Age, area, community, occupation: all of it plays a role. For this, you need to make many cuts of the data and find statistical significance at each level. So it absolutely makes sense to have more people from that category.
Is the number enough?
With 6 lakh total across 294 constituencies, you are working with roughly 2,000 effective samples per constituency on average. The margin of error at 95% confidence works out to about plus or minus 2.2%, and with a realistic design effect accounting for clustered sampling, you are closer to plus or minus 3.5%.
The male sample (4.5 lakh across 294 seats, roughly 1,530 per constituency) is where the real modelling happens. And here is where it gets a bit uncomfortable. PPA is doing bottoms-up. That means they are building the prediction seat by seat, constituency by constituency, not detecting a broad state-level wave and working downward. For that approach, 1,530 respondents per seat with a margin of error of 3.5% is genuinely thin. West Bengal has had plenty of seats decided within that margin. So unless, you get a overwhelmingly large signal with male + female combined, it is a bit difficult to give a verdict for a seat.
So the sample size is the honest weak point (but apparently- this is still the highest number of people polled). It is not fraud, as the tweet implied. It is just a constraint that every field survey operates under, and one that compounds when you are making 294 individual calls rather than one aggregate projection. The results came out right. But that tension between the sample size and the methodology’s ambition doesn’t fully dissolve just because the headline number landed.
Doing it for 4-5 months
There is an important assumption baked into this. If you are collecting opinions over 4-5 months, you are assuming the person’s opinion won’t materially change in that window. That is a risky assumption on paper. But I think it holds in practice more often than not. People don’t really switch their political party of choice in a few months, unless something fairly dramatic happens.
Worth noting though: the SIR controversy (the removal of around 90 lakh voters from the rolls) peaked during the campaign window, well after data collection would have begun. That is exactly the kind of late-breaking structural event that could move opinions, particularly among voters who found their names missing. Whether that showed up in the data or was simply absorbed as noise, we don’t know.
The booth-level sampling within each constituency is another assumption that is hard to audit from the outside. If their 1,500 odd male respondents per constituency skewed toward urban booths, or particular communities, the aggregate swing detection could still be right while individual seat calls were getting lucky. A correct answer arrived at through an imperfect route is still a correct answer, but it is worth knowing which one you have.
For ambiguous problems, you need to absorb some ambiguity by making operational assumptions. That is not a flaw in methodology. It is just how applied work gets done. The alternative is paralysis.
One more thing worth sitting with
There is another data point about this election that I find genuinely interesting, separate from the methodology question.
Before the SIR, West Bengal had more women voters than men: 38.7 million versus 38.4 million. After SIR deletions, that flipped. 5.7 million women were removed from the rolls, against 3.4 million men. Women accounted for 63% of all deletions.
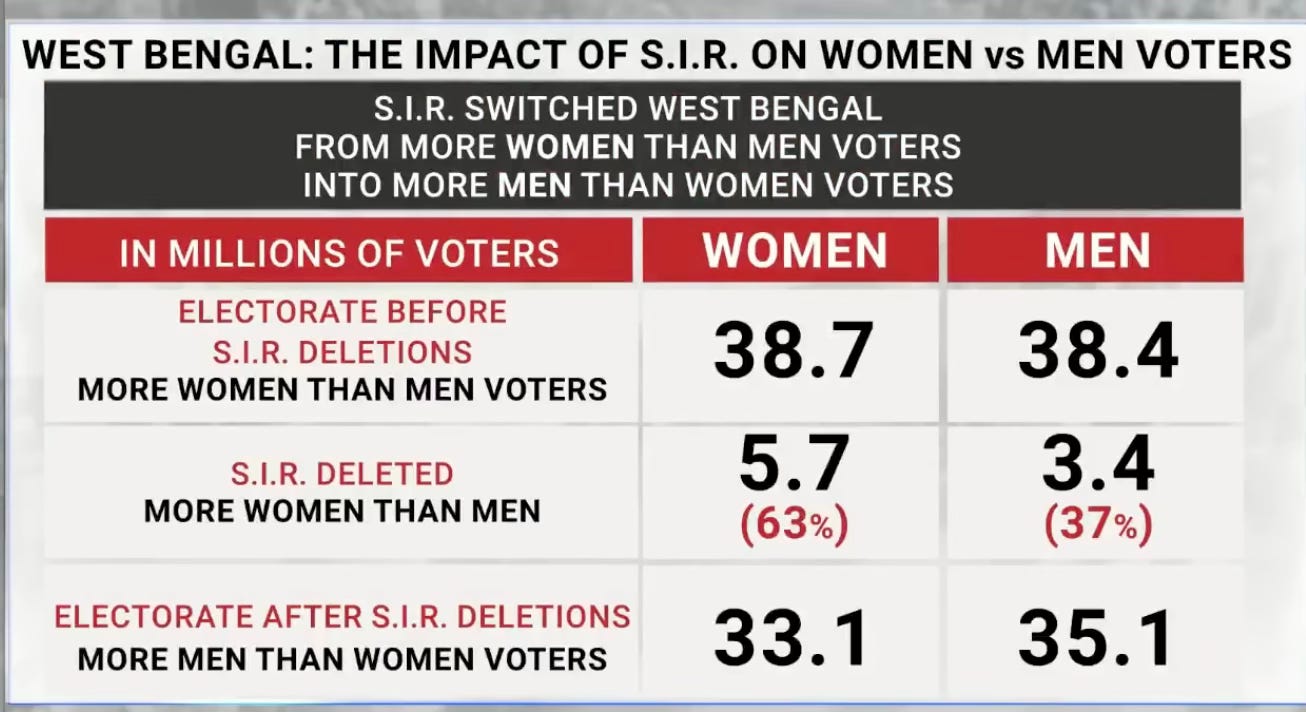
Now, this says nothing about preference. The women who remained may well have voted TMC at exactly the same rates as always. The question of whether 8 in 10 women voted TMC is completely separate from whether there were 38 million or 33 million women on the rolls.
But it does mean that TMC’s female voter base was structurally smaller in 2026 than in any previous election, not because preference shifted, but because a significant chunk of that base was simply not eligible to vote. Whether that was enough to swing seats is something only post-poll data will tell us. The CSDS-Lokniti survey will eventually have the gender crosstabs. Until then, we are speculating.
PPA made their assumptions, committed to them, and got the headline number right. The tweet trying to expose them as fraudulent ended up being a pretty decent advertisement for their approach.
Every model is wrong. This one happened to be useful.
Observations, data, and the not-so-ordinary world. Subscribe if that's your kind of thing.
Share this post, or tell someone about Ordinary Analysis.
The main tweet is now restricted. But it is still there (shared by others): Praja Poll Tweet
Listen to this from 9:00, preferably dubbed: Axis My India - ABP Interview
read this classic presentation on poll forecasting by Rajeeva Karandikar, formerly of ISI Delhi (now in chennai, forget where) https://www.iitk.ac.in/reach/2008/Forecasting/Rajeev.pdf